- News
- Sep 20
CRiskCo FinScore – Model White Paper
Model White Paper
CRiskCo’s FinScore is a credit score, which is a statistical measurement that helps businesses and credit providers make better credit decisions. It is well established that the use of credit scores has a significant impact on economic growth and financial inclusion. Because of better access to real-time and historical financial data, advancements in computer power, and the demand for efficiency, the creation, prediction abilities, and usage have all improved significantly.
Credit scoring is used to approve or reject credit applications, make offers to prospective consumers and businesses, determine pricing levels, and adjust the price to the risk. This method has progressed from traditional statistical methods to the use of advanced algorithms and methods such as random forest, neural network, recursive neural network (RNN), deep neural network, and gradient boosting.
The CRiskCo Credit Score in Mexico, known as FinScore, is a comparison of a company’s financial behavior with that of other companies in the Mexican market, ranging from top performers to bottom performers. It is determined by the company’s financial performance. It states how stable the company is and how much risk it implies to the financial entity.
Examples of what the model looks for
– A demonstrated history of Sales, the trend, and growth
– The level of Customer and Supplier Concentration
– Company’s ability to generate positive Operational Profit
– The strength of the Balance Sheet – the level of Liabilities vs Assets
The score range is between 300 (highest risk) and 850 (lowest risk).
The model was developed in CRiskCo R&D labs, and it is the owner of the IP rights.
Purpose
Finding a model that can rate companies, to provide prediction capabilities for the likelihood of default of companies. The rating system should allow the credit provider to select the highest performing companies and to understand for each applicant where they stand in regards to their peers.
FinScore Model August 1st, 2022
In the following paragraphs we provide data and information on how we built the model and key measurements to explain its statistical strength.
The data set
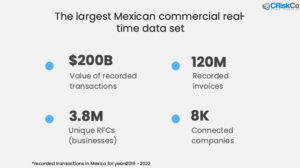
The data set used for developing, testing, and validating the model includes 6,120 companies and 120,000,000 recorded transactions (invoices) totaling over than 220 billion USD from 2019 to 2022.
From the data set we identify two subgroups, and divided the total number of companies to three groups:
1. Defaulted companies, ~200 companies
2. Growing companies, ~1900 companies
3. Undefined companies, ~4,000 companies
Process
The data set was used to train a Machine Learning (ML) model to rate each new applicant and determine whether it is more similar to the first group of defaulted companies or the second group of growing companies. To develop the model, we divided the companies into three groups at random:
1. Training 33%
2. Validating 33%
3. Testing 34%
Percentiles
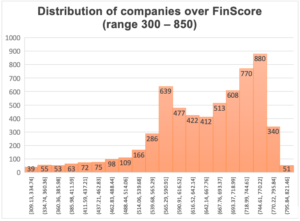
We then divided the companies into 10 percentiles, with 612 companies in each.
The percentiles were ordered from 1st to 10th, with the 1st percentile receiving the lowest scores and the 10th percentile representing the highest 10% of companies receiving the highest score.
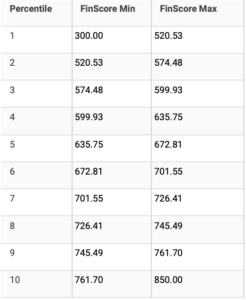
Figure 3: Percentiles score range
The next step was to see how groups 1 and 2 were distributed for each percentile, where the perfect model would place all group 1 at the lowest percentile (1) and group 2 spread across the four top percentiles (7 to 10).
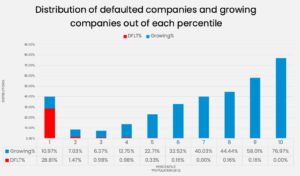
Figure 4 – Distribution of defaulted companies
The graph above clearly shows that the majority of Group 1 events occurred in percentiles 1 and 2, with several unique events occurring in higher percentiles. One company was found in the 6th, 8th, and 9th percentiles.
As a company’s percentile position rises in Group 2, the likelihood of it being a growing company rises dramatically.
Predictors
We can derive several insights and financial behaviors from the model, which we will highlight for business owners and credit providers. Improvements in these features will result in a higher FinScore and a lower likelihood of default. Some are well-known in the industry, while others are more surprising and relevant to the Mexican market’s specific behavior. We do not intend to reveal all features and their weights because this is CRiskCo’s sole intellectual property; however, we do intend to provide tools to help business owners and credit providers understand what we should look for and how it may affect a company’s score. We discovered a strong correlation between the following features:
– Customer Concentration Risk
– Supplier Concentrations Risk
– Company size
– A steady stream of revenue
– Growth in sales for the past 24 months
– Days Sales Outstanding (DSO)
– Company age
Our advice to business owners who want to improve their score is to diversify their revenue stream from a variety of clients, as well as to invest in finding competing providers and working with several of them.
Furthermore, maintaining a consistent flow of revenue while increasing revenue on average can strengthen the company’s position and result in a higher score.
Finally, we discovered that favoring card transactions (credit/debit) is likely to support your business growth and result in a higher FinScore for the business.
Ongoing model and future development
The data and the ability to extract insights from the data are the foundations of CRiskCo’s machine learning model. As our dataset grows every week, and we learn from newly defaulted company cases; the model will be updated quarterly. The FinScore will change with each release of the new model, and we will make the new Percentile table available.
We are investing time and resources to improve and create additional models that can help, and we plan to release them in the near future as we learn what the market requires and what we can see from the data. If you have any suggestions or questions about a future model, please send an email to contact@criskco.com, and we will respond as soon as possible.
Conclusion
As shown in Figure 4, we discovered a strong and clear correlation between the FinScore a company receives and the likelihood to be a defaulting or growing company. As a credit provider, you can use the model to assess applicant performance as well as the company’s ability to repay debt or successfully return a loan.
As a CRiskCo client, you automatically receive the FinScore embedded into our platform for any company connected in Mexico without any action on your part.
Dataset Statistics Summary
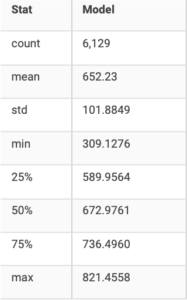
Figure 5 – Dataset statistics summary
Dictionary
– Alternative data
Data collected from nontraditional data sources. Geolocation data, point-of-sale transactions, device data, and social media posts are some examples.
– Credit rating
A numerical expression that represents an entity’s creditworthiness.
– Credit scoring
A statistical analysis that estimates the likelihood that a loan applicant, existing borrower, or counterparty will default or become delinquent.
– Credit reporting service provider
Entity that manages a mechanism for collecting, processing, and distributing credit information to data users, as well as providing value-added services based on such data.
– Credit services provider
A company that provides loans and other forms of credit available to consumers and businesses. Financial institutions, banks, financial technology providers, and alternative lenders are all included.
– Overfitting
The analysis corresponds too closely to a specific set of training data, resulting in an inability to accurately predict future observations.
– Structured data
Any data contained within a fixed field of a record or file. Typically, data is stored in relational databases and spreadsheets. The formal structure makes it simple to enter, store, query, and analyze data.
– Unstructured data
Data that lacks a predefined data model or is not organized in a predefined way. Text files, images, social media data, and sensor data are common examples.
– Customer Concentration Risk
Customer concentration is a measure of the distribution of total revenue generated by the customer base. A company selling to a large number of small-volume customers has a lower customer concentration than a business which is dependent on a small number of large customers for the majority of its sales.
– Supplier Concentrations Risk
Supplier concentration is a measure of the distribution of total purchases from the supplier base. A company purchasing from a large number of small-volume suppliers has a lower supplier concentration than a business which is dependent on a small number of large suppliers for the majority of its inputs.
– Company size
Criteria for company size is based on annual revenues where: Small < 5M MXN, Mid Size 5 – 6.7M, Large 6.7 – 180M and Global > 180M.
– A steady stream of revenue
Company revenue is evaluated as the vitality of the company revenue month by month. A simple way to measure it is to sum all the differences.
Formula: ABS(month_revenue_1 – month_revenue_0) + ABS(month_revenue_2 – month_revenue_1) + ABS(month_revenue_3 – month_revenue_2) …
Where:
ABS = absolute
month_revnue_X = total revenue in month X.
– Growth in sales for the past 24 months
Growth in sales is achieved by having a 20% or more increase in the total invoices issued to customers in the last 12 month, compared to the previous 12 months total.
– Days Sales Outstanding (DSO)
Days sales outstanding is a measure of the average number of days that it takes a company to collect payment for a sale. The calculation is based on the annual financial statements.
– Company age
Company age is measured as the years the company has been operating. Younger businesses are less likely to have a track record in terms of establishing themselves, tend to have fewer assets, and are generally smaller than more established ones.
– Percentile
A percentile (or a centile) is a measure used in statistics indicating the value below which a given percentage of observations in a group of observations fall. For example, the 20th percentile is the value (or score) below which 20% of the observations may be found.
– Artificial Intelligence (AI)
Artificial intelligence (AI) is intelligence demonstrated by machines, as opposed to the natural intelligence displayed by animals including humans. AI research has been defined as the field of study of intelligent agents, which refers to any system that perceives its environment and takes actions that maximize its chance of achieving its goals.[a] *source wikipedia
– Machine Learning (ML)
Machine learning (ML) is a field of inquiry devoted to understanding and building methods that ‘learn’, that is, methods that leverage data to improve performance on some set of tasks.[1] It is seen as a part of artificial intelligence. Machine learning algorithms build a model based on sample data, known as training data, in order to make predictions or decisions without being explicitly programmed to do so.[2] Machine learning algorithms are used in a wide variety of applications, such as in medicine, email filtering, speech recognition, and computer vision, where it is difficult or unfeasible to develop conventional algorithms to perform the needed tasks.[3]*source wikipedia
– CRiskCo
CRiskCo pioneered the concept of Open Accounting, in which we provide a single API to integrate with accounting systems. With our big data processing and cloud infrastructures, we help vendors and financial institutions cut underwriting times and costs. We assist financial institutions in evaluating the integrity of their loan applicants, detecting fraud, and predicting future credit failures.CRiskCo operates in Mexico, the USA, Israel, and Australia, and can be easily reached at contact@criskco.com or visit our website at www.criskco.com.mx
Related Posts

An Open Letter to Mexico’s Small Business Community
By Erez Saf – Pymes Capital and CRiskCo CEO, at Mexico Business News Dear Small and Medium Business Owners, Securing financing is critical for growth, yet many business owners and CFOs miss out on these…
- Nov 25
🚀 Case Study: IRM Leasing’s Success with CRiskCo
Executive Summary In the competitive financial world, where precision and trust are key, IRM Leasing decided to transform its credit evaluation processes. Partnering with CRiskCo, they reached new levels in fraud detection and accelerated their…
- Nov 18
Recent Posts
Subscribe
Join our newsletter and stay up to date!