- Blog
- Jan 16
How to measure collection performance
2 tools that will improve your A/R collection effectiveness
There are many opinions concerning methods for measuring the efficiency of collecting A/R. In this blog post, we will discuss the most common method for calculating and measuring the effectiveness of your organization’s A/R collections.
“Why?”
Why would an organization want to measure the effectiveness of its collections? Most organizations do not measure it in a controlled and constant way. They usually do not even compare it to previous results. In fact, most organizations do not really know if their collections have become better or worse. Perhaps the market has changed, customers have changed, or maybe even sales have changed.
Measuring the collection efficiency has some distinct advantages:
- When measuring the collection, you also get a strong clue about your sales
- When knowing how long it takes for your organization to collect, you can improve how you give credit to your customers
- You improve the collection department efficiency and functionality
- The biggest advantage is that you can tell which customers are receiving credit but aren’t worthy of it
DSO
The most common way to measure the effectiveness of the organization’s collection is with the DSO (Days Sales Outstanding).
What is DSO
DSO is a calculation that measures the average days it takes for an organization to collect its revenues. For example, for an organization in which all customers pay cash up front, the DSO will be 0, but organizations with invoices and payment terms will have a DSO greater than 0. The organization’s goal will be to have as low a DSO as possible, because it means that the organization collects its money fast and its cash flow is more stable. It also means that the organization can spend money faster and thus grow faster.
How to calculate DSO
The DSO calculation is very simple. The data required are:
- Duration (in days) – The period of time you want to measure
- Total A/R – Sum of Account Receivable from all your customers
- Total credit sales – Revenue sum from credit sales in the period of time you want to measure (do not include cash sales)
The formula is:

For example, in 2015 you made sales at $10 million. At the end of the year, there are still unpaid invoices totaling $1.2 million.

What is a “good” DSO?
How do you know whether your organization’s DSO is good? The answer is a bit complex because it depends on the industry, geographical area, the payment terms that the organization provides to its customers, and so on. In general, the higher the organization’s income the higher DSO the organization can “afford,” but if it is a small organization with low income, high DSO can bring cash flow problems
The rule of thumb for normal DSO is lower than 45 (when payment terms are net+30), but you cannot accept this figure as a starting point. You should compare your DSO score to similar organizations (in terms of industry, size, and location), as well as compare your current DSO to previous results to see if the organization has improved or not.
CriskCo.com solutions are perfect for DSO measurement because it can compare your organization’s results to similar organizations and to your history, so you get a clear picture of your collection performance.
ADD
The DSO alone is not enough to get a clear view of the collection efficiency. To get a clearer picture, you should become acquainted with a second very important measure: ADD
What is ADD?
ADD – Average days delinquent. The average number of days the payment is made after the invoice due date.
Tracking your ADD alongside the DSO will provide a rich, full picture about your organization’s collecting efficiency and about the ability to turn Accounts Receivable into cash
How to calculate ADD
In order to calculate ADD, you first need to know your DSO and Best DSO
The data required to calculate Best DSO:
- Duration (in days) – The period of time you want to measure
- Current A/R – The sum of Accounts Receivable from all your customers where the invoice due date has not yet passed
- Total Credit Sales – Revenue sum from credit sales in the period of time you want to measure (do not include cash sales)
The formula is:

For example, in 2015 you made sales at $10 million. At the end of the year, there are still unpaid invoices totaling $1.2 million, of which $800,000 has a due date equal or greater than today.

The ADD calculation is performed according to the following formula:

In our example:

What is a “good” ADD?
Also in this case, the lower the ADD the better. If your organization has ADD = 0 it means that your customers always pay on time. The ADD should be compared exactly as you compare the DSO, i.e., depending on the organization, industry, and location, and in particular it must compare to previous results within the organization.
CriskCo.com solutions help with ADD as well. The CriskCo.com Monitor can compare your organization’s ADD and DSO to other similar organizations and track your results.
How to analyze the relationship between ADD and DSO
The DSO and ADD give great information separately, but together these two measures give the organization a rich view of the organization’s collection state.
When ADD and DSO decline together
When the two decline together, it means the collection department does a better job, and they are able to collect payments faster.

1: DSO & ADD Improving together
When ADD and DSO rise together
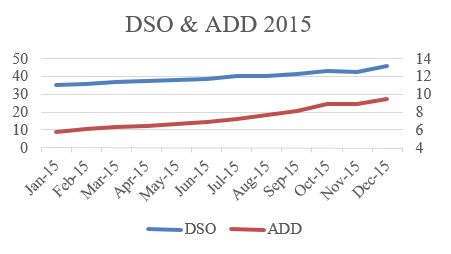
When the two rise together, it means the collection department doesn’t do a good a job, and the collection is delayed. Customers pay late more often and the organization’s cash flow is less stable.

2 : DSO & ADD rise together
When ADD and DSO go in different directions
When the two move in opposite directions it means that the answer to collection efficiency is complex and the organization must give it time and thought.

3: DSO & ADD in different direction
When the DSO falls, the organization may think that collection is improving, but this can be misleading if – parallel to the DSO falling – the ADD rose. In such a case, it is inconceivable that the collection is enhanced when it takes longer for customers to pay (on average).The improvement in DSO can be explained by many factors not necessarily related to collection efficiency, for example, if a change in the payment terms of customers (rather than net+120, the current payment terms were modified to net+60), or it might be related to the customer service department that provided clear information or faster resolution discussions about payment. It may also be for reasons completely unrelated to your organization.
Related Posts

Case Study: Imagina Leasing’s Improved Credit Decisions
Executive Summary Imagina Leasing, a leader in Mexico’s leasing industry, was on a mission to enhance the precision and security of its credit evaluations. Facing challenges in verifying financial documents and managing risks, they turned…
- Nov 14

Strengthen Risk Management with the New Financial Suppliers Tab
We’re thrilled to unveil an exciting update to our UI! Introducing the “Financial Suppliers” tab, now available on the company reports page and in the SAT information report. Know Your Competition and Past Financing Deals…
- Jul 29
Recent Posts
Subscribe
Join our newsletter and stay up to date!